Wall Street experienced a downturn last week. Investors were in a “risk-off” mood as the war in Iran escalated, while AI and semiconductor shares dropped, which dragged the overall market lower. Each of the major market indexes lost value, ending a streak of favorable weekly performances. Traders moved away from Megacap shares, which pulled prices lower. Energy, consumer staples, real estate, and financials outperformed, while information technology, consumer discretionary, and communication services declined. Crude oil extended its gains to above $81.00 per barrel, reaching its highest level in a month, after Iran and the U.S. each launched more military strikes.
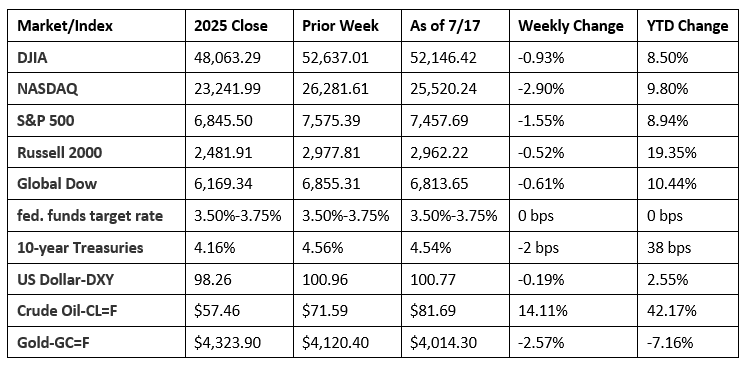
Chart reflects price changes, not total return. Because it does not include dividends or splits, it should not be used to benchmark performance of specific investments.
Last Week’s Economic News
- The Consumer Price Index (CPI) decreased 0.4% in June after rising 0.5% in May, the U.S. Bureau of Labor Statistics reported. This decline was the largest one-month decrease since April 2020, when it fell 0.8%. Over the last 12 months, consumer prices increased 3.5%. Energy prices fell 5.7% in June after rising 3.9% in May. The drop in prices for energy was the largest contributor to the monthly CPI decrease, more than offsetting increases for shelter and food. Prices for food increased 0.2% in June, while shelter prices rose 0.1%. Over the last 12 months, food prices are up 3.0%, and shelter prices rose 3.3%. Core prices, excluding food and energy, were flat in June but up 2.6% over the last 12 months.
- The Producer Price Index fell 0.3% in June, after advancing 0.6% in May and 1.1% in April. Producer prices increased 5.5% for the 12 months ended in June. The June decline can be attributed to prices for goods, which fell 1.4%, marking the largest decrease since July 2022. Leading the goods decrease in June was a 6.4% drop in energy prices (gasoline prices fell 12.0%). In contrast, prices for services rose 0.2% last month.
- Retail sales rose 0.2% in June from the previous month and 6.7% from June 2025. Nonstore (online) retail sales rose 1.9% last month and 14.2% from a year ago. Conversely, gasoline sales fell 5.3% in June but were up 19.8% from a year earlier.
- U.S. import prices increased 0.3% in June, following a 1.7-% advance in May. Higher prices for nonfuel imports more than offset lower prices for fuel imports in June. U.S. import prices advanced 7.1% for the 12 months ended in June, the largest 12-month increase since the prices rose 7.7% in August 2022. Prices for U.S. exports decreased 0.6% in June, after rising 1.2% the previous month. Export prices increased 10.2% from June 2025.
- Industrial production (IP) ticked up 0.1% in June. Manufacturing output was unchanged in June. Mining and utilities both grew 0.4% in June. Total IP in June was 1.1% above its year-earlier level. Manufacturing increased 1.1% from June 2025. Mining increased 2.4% over the last 12 months, while utilities ticked up 0.3%.
- According to the latest information, the government deficit was $120 billion in June, $172 billion less than the May deficit. Through nine months of the current fiscal year, the deficit sits at $1,367 billion, marginally above the deficit over the same period last fiscal year ($1,337 billion). Thus far in FY 2026, government receipts amounted to $4,151 billion, of which the primary contributors were individual income taxes ($2,196 billion), social insurance and retirement ($1,384 billion), and corporation income taxes ($279 billion). Custom duties (tariffs) accounted for $163 billion. Over the same period, government expenditures totaled $5,518 billion, of which Social Security payments ($1,244 billion) were the largest expenditures.
- The number of issued residential building permits declined 3.0% in June and 2.3% from a year earlier. The number of building permits issued for single-family construction fell 2.4% last month. Conversely, the number of housing starts rose 19.0% in June and 3.5% from June 2025. Single-family housing starts in June were 0.2% below the May estimate. Housing completions in June were 3.3% above the May total and 1.5% above the June 2025 rate. Single-family housing completions in June were 6.6% above the May rate.
- For the week ended July 11, there were 208,000 new claims for unemployment insurance, a decrease of 8,000 from the previous week’s level, which was revised up by 1,000. According to the Department of Labor, the advance rate for insured unemployment claims for the week ended July 4 was 1.2%, unchanged from the prior week’s rate. The advance number of those receiving unemployment insurance benefits during the week ended July 4 was 1,805,000, a decrease of 16,000 from the previous week’s level, which was revised up by 7,000. States and territories with the highest insured unemployment rates for the week ended June 27 were New Jersey (2.3%), Puerto Rico (2.3%), Rhode Island (2.2%), Minnesota (2.1%), Massachusetts (2.0%), Oregon (2.0%), California (1.9%), Washington (1.9%), Connecticut (1.7%), and Pennsylvania (1.7%). The largest increases in initial claims for unemployment insurance for the week ended July 4 were in California (+8,078), Missouri (+6,037), New York (+4,587), Michigan (+4,458), and Tennessee (+2,331), while the largest decreases were in New Jersey (-2,674), Connecticut (-2,619), Oregon (-2,284), Maryland (-1,223), and Florida (-1,218).
- The national average retail price for regular gasoline was $3.855 per gallon on July 13, $0.078 per gallon above the prior week’s price and $0.725 per gallon higher than a year ago. Also, as of July 13, the East Coast price increased $0.065 to $3.765 per gallon; the Midwest price rose $0.131 to $3.662 per gallon; the Gulf Coast price climbed $0.080 to $3.423 per gallon; the Rocky Mountain price increased $0.162 to $3.823 per gallon; and the West Coast price ticked up $0.001 to $4.832 per gallon.
Eye on the Week Ahead
This is a slow week for the release of notable economic data. However, the June figures on new home sales, released by the Census Bureau, is out this Friday. May saw new home sales drop over 7.0%, although both the median ($424,900) and average ($540,600) sales prices increased from their respective prior months’ estimates.
The Week Ahead

The information provided is obtained from sources believed to be reliable. Forecasts cannot be guaranteed. Past performance is not a guarantee of future results.
Data sources: Economic: Based on data from U.S. Bureau of Labor Statistics (unemployment, inflation); U.S. Department of Commerce (GDP, corporate profits, retail sales, housing); S&P/Case-Shiller 20-City Composite Index (home prices); Institute for Supply Management (manufacturing/services). Performance: Based on data reported in WSJ Market Data Center (indexes); U.S. Treasury (Treasury yields); U.S. Energy Information Administration/Bloomberg.com Market Data (oil spot price, WTI, Cushing, OK); www.goldprice.org (spot gold/silver); Oanda/FX Street (currency exchange rates).
© 2026 Broadridge Financial Solutions, Inc. All Rights Reserved.