The benchmark indexes closed lower last week, snapping a multi-week winning streak. Despite a rally last Friday, stocks retreated in response to elevated Treasury yields, rising crude oil prices, mixed corporate earnings, and weakness in key tech and mega-cap shares. Among the market sectors, only health care, materials, and energy closed the week higher. Bonds experienced a sharp sell-off, particularly in long-term Treasuries, driven by growing fiscal deficit concerns, stubborn energy-driven inflation risks, and heavy debt issuance.
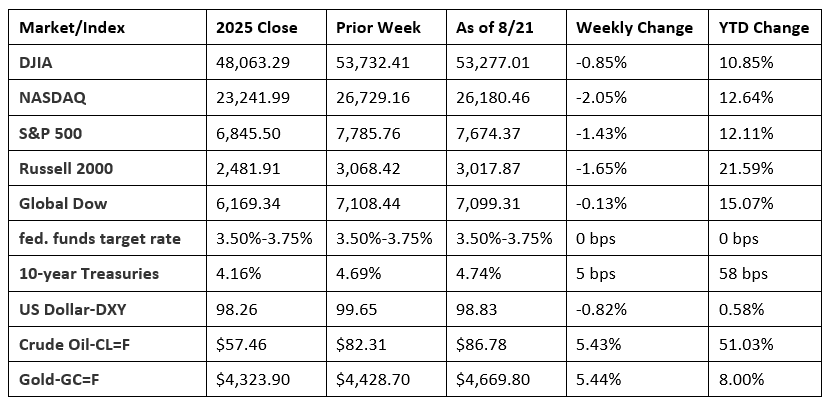
Chart reflects price changes, not total return. Because it does not include dividends or splits, it should not be used to benchmark performance of specific investments.
Last Week’s Economic News
- The number of issued residential building permits rose 5.0% in July over the June estimate and 3.1% above the July 2025 rate. Single-family building permits in July were 2.5% above the June figure. Housing starts in July were 12.4% below the June figure and 13.5% below the estimate from a year earlier. Single-family housing starts in July were 9.9% below the revised June figure. Housing completions in July were 9.1% below the June estimate and 16.8% under the July 2025 rate. Single-family housing completions in July were 5.8% below the June rate.
- U.S. import prices decreased 0.4% in July following a 0.3% decline in June. Lower prices for fuel imports more than offset higher prices for nonfuel imports in July. Despite the monthly decline, prices for U.S. imports increased 5.9% for the 12 months ended July 2026. Prices for U.S. exports decreased 1.3% in July after falling 0.7% the previous month. Over the past year, U.S. export prices increased 8.2%.
- Industrial production (IP) and manufacturing production each grew 0.2% in July after increasing 0.3% in June. In July, mining and utilities increased 0.2% and 0.5%, respectively. Manufacturing output excluding motor vehicles and parts increased 0.4%. Total IP in July was 1.1% above its year-earlier level.
- For the week ended August 15, there were 206,000 new claims for unemployment insurance, a decrease of 6,000 from the previous week’s level, which was revised up by 3,000. According to the Department of Labor, the advance rate for insured unemployment claims for the week ended August 8 was 1.2%, unchanged from the prior week’s rate. The advance number of those receiving unemployment insurance benefits during the week ended August 8 was 1,799,000, an increase of 18,000 from the previous week’s level, which was revised up by 4,000. States and territories with the highest insured unemployment rates for the week ended August 1 were New Jersey (2.6%), Puerto Rico (2.6%), Rhode Island (2.2%), Massachusetts (2.1%), Minnesota (2.1%), Oregon (2.0%), California (1.9%), Washington (1.9%), Connecticut (1.7%), Nevada (1.7%), New York (1.7%), and Pennsylvania (1.7%). The largest increases in initial claims for unemployment insurance for the week ended August 8 were in Michigan (+1,931), New York (+1,379), Texas (+1,324), South Carolina (+1,268), and Illinois (+994), while the largest decreases were in Ohio (-252), Iowa (-103), Kentucky (-87), Louisiana (-41), and North Dakota (-33).
- The national average retail price for regular gasoline was $4.049 per gallon on August 17, $0.043 per gallon above the prior week’s price and $0.924 per gallon higher than a year ago. Also, as of August 17, the East Coast price decreased $0.021 to $3.863 per gallon; the Midwest price rose $0.122 to $3.938 per gallon; the Gulf Coast price increased $0.079 to $3.622 per gallon; the Rocky Mountain price advanced $0.164 to $4.285 per gallon; and the West Coast price ticked up $0.011 to $5.086 per gallon.
Eye on the Week Ahead
Most of the attention will be focused on the latest report on gross domestic product and on the personal consumption expenditures price index, an important measure of inflation.
The Week Ahead

The information provided is obtained from sources believed to be reliable. Forecasts cannot be guaranteed. Past performance is not a guarantee of future results.
Data sources: Economic: Based on data from U.S. Bureau of Labor Statistics (unemployment, inflation); U.S. Department of Commerce (GDP, corporate profits, retail sales, housing); S&P/Case-Shiller 20-City Composite Index (home prices); Institute for Supply Management (manufacturing/services). Performance: Based on data reported in WSJ Market Data Center (indexes); U.S. Treasury (Treasury yields); U.S. Energy Information Administration/Bloomberg.com Market Data (oil spot price, WTI, Cushing, OK); www.goldprice.org (spot gold/silver); Oanda/FX Street (currency exchange rates).
© 2026 Broadridge Financial Solutions, Inc. All Rights Reserved.