The stock and bond markets were closed last Monday to observe the Juneteenth federal holiday. Then, after three weeks of bruising losses, stocks rebounded over the next four days to deliver solid gains. Investors hung on every word during Fed Chair Jerome Powell’s two days of testimony before Congress, but ironically it was signs of economic weakness that seemed to lift their spirits. The tech-heavy Nasdaq surged 7.5% and the S&P 500, which increased 6.5%, had its second-best showing of the year. The Russell 2000 rose 6.0%, followed by the Dow (5.4%) and the Global Dow (2.5%). Crude oil prices dropped (5.4%) for the second week in a row.
Investors were ready to rally last Tuesday, the first trading day after a nerve-wracking week in which U.S. stocks suffered their worst one-week decline since March 2020. The Nasdaq jumped 2.5%, followed by the S&P 500 (2.4%), the Dow (2.1%), the Russell 2000 (1.7%), and the Global Dow (1.4%). Gains were widespread across all 11 market sectors. A sell-off in U.S. government bonds pushed the yield on 10-year Treasuries above 3.3%. Crude oil prices climbed, while gold and the dollar dipped.
On Wednesday, Powell told Congress that attempting to control inflation (by hiking interest rates) is essential, and while the Committee’s intent is not to provoke a recession, “it’s certainly a possibility.” U.S. stocks swung between losses and gains before ending the day slightly in the red. The Global Dow fell 0.7%, while the Dow and the Russell 2000 slipped 0.2%. Both the S&P 500 and the Nasdaq barely dipped (-0.1%). With recession fears taking center stage, oil prices sunk 2.5% on expectations for reduced demand. The dollar weakened and gold prices advanced.
U.S. stocks ended higher last Thursday, even though the market remained jittery during the second day of Powell’s testimony. The Global Dow lost 0.9%, but the benchmark U.S. indexes listed here posted gains, led by the Nasdaq (1.6%) and followed by the Russell 2000 (1.2%), the S&P 500 (0.9%), and the Dow (0.6%). Information technology shares outperformed, as did defensive sectors including utilities, health care, real estate, and consumer staples. Economically sensitive sectors lagged, especially energy, which fell 3.75%. The yield on 10-year Treasuries declined 7 basis points to 3.08%. Crude oil and gold prices fell, and the dollar advanced.
Stocks soared on Friday after the May reading of a closely watched gauge of longer-term consumer inflation expectations was revised downward from an alarming 14-year high. Weakening economic data offered some hope that cooler inflation could potentially reduce the need for drastic rate hikes by the Fed. The Nasdaq jumped 3.3%, followed by the Russell 2000 (3.2%), the S&P 500 (3.1%), the Dow (2.7%), and the Global Dow (2.2%). All 11 market sectors ended the day higher. Treasury yields ticked up, while crude oil prices, gold, and the dollar fell.
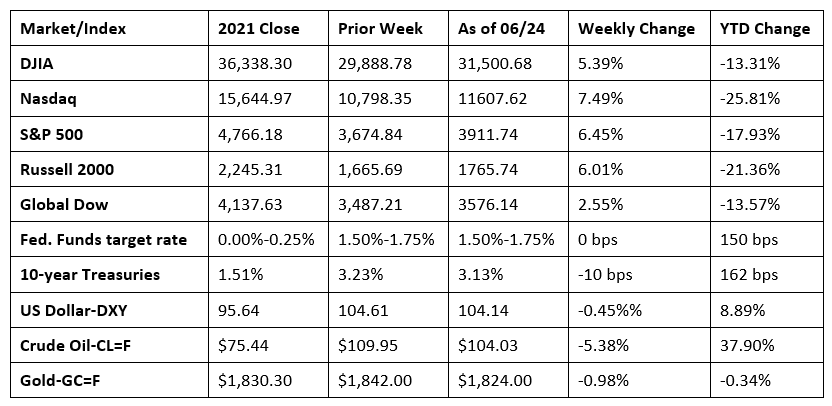
Chart reflects price changes, not total return. Because it does not include dividends or splits, it should not be used to benchmark performance of specific investments.
Last Week’s Economic News
- After four straight months of declines, sales of new single-family homes jumped 10.7% in May above the prior month’s total, according to the Census Bureau. However, new home sales were 5.9% below the level in May 2021. The median sales price of new houses sold in May 2022 was $449,000. The average sales price was $511,400. Inventory of new homes for sale sat at a supply of 7.7 months in May at the current sales pace.
- Sales of existing homes fell for the fourth straight month in May after declining 3.4% from April and 8.6% year-over-year. According to the National Association of Realtors®, home sales have essentially returned to levels last seen in 2019, before the pandemic supercharged the market. Further sales declines are expected due to affordability challenges worsened by the sharp rise in mortgage rates. Total housing inventory at the end of May increased 12.6% from April but fell 4.1% from one year ago. Unsold inventory sits at a 2.6-month supply at the present sales pace, up from 2.2 months in April and 2.5 months in May 2021. The median existing-home price for all housing types in May was $407,600, a rise of 14.8% from May 2021 ($355,000). Sales of existing single-family homes were also down in May after falling 3.6% from April and 7.7% year-over-year. The median existing single-family home price was $414,200 in May, up 14.6% from a year ago.
- For the week ended June 18, there were 229,000 new claims for unemployment insurance, a decrease of 2,000 from the previous week’s level, which was revised up by 2,000. According to the Department of Labor, the advance rate for insured unemployment claims for the week ended June 11 was 0.9%, unchanged from the previous week’s rate. The advance number of those receiving unemployment insurance benefits during the week ended June 11 was 1,315,000, an increase of 5,000 from the previous week’s level, which was revised down by 2,000. States and territories with the highest insured unemployment rates for the week ended June 4 were New Jersey (1.9%), California (1.8%), Puerto Rico (1.6%), Alaska (1.5%), New York (1.4%), Pennsylvania (1.4%), Rhode Island (1.3%), Hawaii (1.2%), and Massachusetts (1.2%). The largest increases in initial claims for the week ended June 11 were in California (+3,951), Pennsylvania (+2,615), Illinois (+1,903), Ohio (+1,772), and Michigan (+1,587), while the largest decreases were in Missouri (-1,297), Tennessee (-831), Kentucky (-202), Mississippi (-146), and New Mexico (-103).
Eye on the Week Ahead
The final estimate for first-quarter gross domestic product is available this week. So far, available data has shown that the economy retracted at an annual rate of -1.5%, compared to an increase of 6.9% in the fourth quarter of 2021. The latest report on personal income and spending is also out this week. Included in this report is the personal consumption expenditures price index, a measure of inflation favored by the Federal Reserve. The PCE price index was up 6.3% in April from 12 months earlier.
The Week Ahead

The information provided is obtained from sources believed to be reliable. Forecasts cannot be guaranteed. Past performance is not a guarantee of future results.
© 2021 Broadridge Financial Solutions, Inc. All Rights Reserved.