Most markets were closed last Friday in observance of Juneteenth National Independence Day. Wall Street rallied last week as investors displayed optimism over the signing of an initial agreement ending hostilities in the Middle East. Market gains were realized despite the Federal Reserve holding interest rates steady at 3.50%-3.75% following the first meeting under new Fed Chair Kevin Warsh. Inflationary pressures continued to influence market developments as the Fed projected the potential for at least one interest rate hike before the end of the year, while upwardly revising its inflation projection to 3.6% (from 2.7% previously forecasted). The interim agreement between the U.S. and Iran also led to a further decrease in crude oil prices, which fell to their lowest levels since early March.
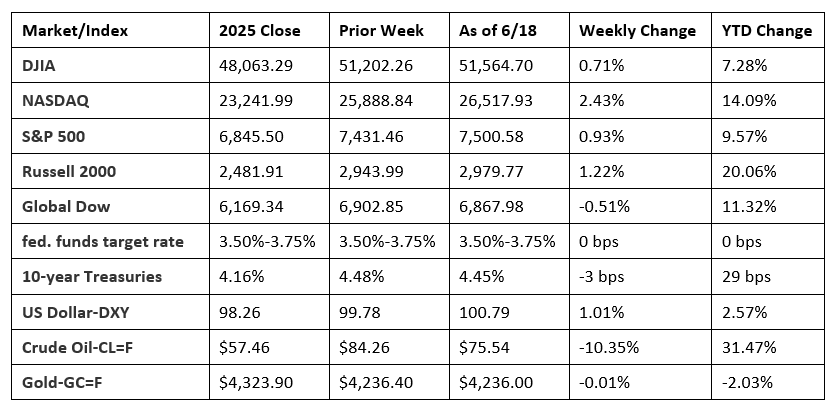
Chart reflects price changes, not total return. Because it does not include dividends or splits, it should not be used to benchmark performance of specific investments.
Last Week’s Economic News
- In one of the briefest statements in quite some time, the Federal Open Market Committee, by a 12-0 vote, decided to maintain the target range of the federal funds rate at 3.50%-3.75%. The Committee noted that economic activity is expanding at a solid pace despite uncertainty due to the conflict in the Middle East. The FOMC also noted that job gains have kept pace with the workforce, and the unemployment rate has changed little. Lastly, the Committee noted that inflation remained elevated, in part reflecting supply shocks that have driven price increases in certain sectors, including energy.
- Retail sales rose 0.9% in May from the previous month and 6.9% from a year ago. Retail trade sales were up 1.0% from April 2026 and 7.5% from last year. Nonstore (online) retailer sales advanced 1.5% from April and 12.2% from last year, while sales at food services and drinking places ticked down 0.1% in May but rose 2.7% from May 2025.
- Industrial production (IP) edged up 0.1% in May after rising 0.9% in April. Manufacturing output was unchanged in May after increasing 0.7% in April. In May, mining rose 1.3%, while utilities decreased 0.4%. Total IP in May was 1.7% above its year-earlier level.
- The number of issued residential building permits in May was 0.7% below the April rate and 0.2% under the May 2025 estimate. Issued building permits for single-family homes in May were 0.6% above the April figure. In May, the number of housing starts was 15.4% below the April estimate and 8.7% under the figure from a year earlier. Single-family housing starts in May were 1.9% under the April rate. Home completions in May were 8.1% under the April rate and 14.2% below the May 2025 estimate. Single-family housing completions in May were 1.6% below the April rate.
- U.S. import prices increased 1.9% in May following a 2.0% rise in April. Higher prices for fuel imports and nonfuel imports drove the advance in May. Prices for U.S. imports rose 6.7% from May 2025, the largest 12-month advance since prices rose 7.7% for the 12 months ended in August 2022. Prices for U.S. exports increased 1.3% in May after rising 3.5% the previous month. U.S. export prices increased 11.2% over the 12-month period ended in May, the largest 12-month advance since the prices rose 11.2% for the 12 months ended in August 2022.
- For the week ended June 13, there were 226,000 new claims for unemployment insurance, a decrease of 4,000 from the previous week’s level, which was revised up by 1,000. According to the Department of Labor, the advance rate for insured unemployment claims for the week ended June 6 was 1.2%, unchanged from the prior week’s rate. The advance number of those receiving unemployment insurance benefits during the week ended June 6 was 1,810,000, an increase of 24,000 from the previous week’s level, which was revised down by 9,000. States and territories with the highest insured unemployment rates for the week ended May 30 were New Jersey (2.1%), Washington (2.0%), California (1.9%), Massachusetts (1.9%), Oregon (1.7%), Rhode Island (1.7%), Nevada (1.6%), New York (1.6%), Puerto Rico (1.6%), Illinois (1.4%), and Minnesota (1.4%). The largest increases in initial claims for unemployment insurance for the week ended June 6 were in Pennsylvania (+5,381), Minnesota (+5,373), California (+5,095), Texas (+2,835), and Puerto Rico (+2,677), while the largest decreases were in Tennessee (-1,077), Oklahoma (-456), Mississippi (-392), Kansas (-307), and Missouri (-267).
- The national average retail price for regular gasoline was $4.052 per gallon on June 15, $0.094 per gallon below the prior week’s price but $0.913 per gallon higher than a year ago. Also, as of June 15, the East Coast price decreased $0.077 to $3.913 per gallon; the Midwest price dipped $0.084 to $3.861 per gallon; the Gulf Coast price declined $0.122 to $3.521 per gallon; the Rocky Mountain price decreased $0.090 to $4.104 per gallon; and the West Coast price declined $0.129 to $5.229 per gallon.
Eye on the Week Ahead
There’s plenty of important economic data released this week. The final estimate of first-quarter gross domestic product is out mid week. Thus far, the previous estimate has the economy expanding at an annual rate of 1.6%. Also of note this week is the release of the latest report on the personal consumption expenditures price index, the Fed’s preferred measure of inflation. In April, consumer prices rose 0.4% for the month and 3.8% over the past 12 months.
The Week Ahead

The information provided is obtained from sources believed to be reliable. Forecasts cannot be guaranteed. Past performance is not a guarantee of future results.
Data sources: Economic: Based on data from U.S. Bureau of Labor Statistics (unemployment, inflation); U.S. Department of Commerce (GDP, corporate profits, retail sales, housing); S&P/Case-Shiller 20-City Composite Index (home prices); Institute for Supply Management (manufacturing/services). Performance: Based on data reported in WSJ Market Data Center (indexes); U.S. Treasury (Treasury yields); U.S. Energy Information Administration/Bloomberg.com Market Data (oil spot price, WTI, Cushing, OK); www.goldprice.org (spot gold/silver); Oanda/FX Street (currency exchange rates).
© 2026 Broadridge Financial Solutions, Inc. All Rights Reserved.