For just the second time in the last 13 weeks, both the S&P 500 and the NASDAQ recorded weekly losses. AI stocks, which had driven the market for much of the year, experienced a notable drop, despite favorable earnings reports from some major microchip companies. Investors moved away from tech to more value-driven sectors, such as health care, real estate, and utilities. Consumer staples shares gained ground, helping to push small caps higher. The Dow held firm for much of the week. Crude oil prices fell to pre-Iran war levels as shipping traffic accelerated through the Strait of Hormuz.
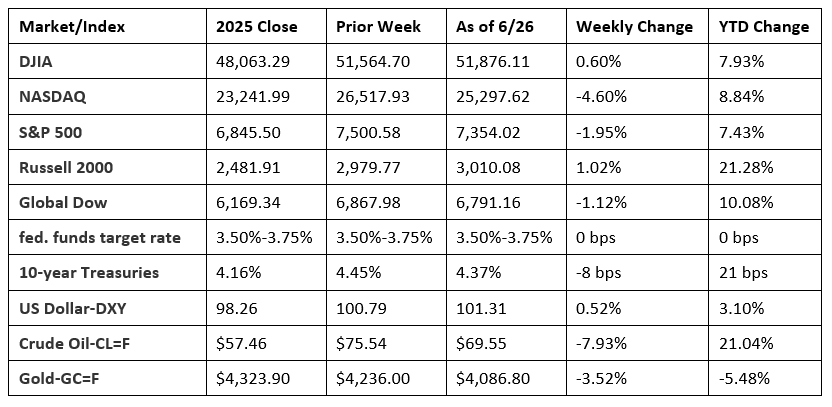
Chart reflects price changes, not total return. Because it does not include dividends or splits, it should not be used to benchmark performance of specific investments.
Last Week’s Economic News
- The economy expanded at an annualized rate of 2.1% in the first quarter, according to the third and final estimate from the Bureau of Economic Analysis. Gross domestic product increased at an annualized rate of 0.5% in the fourth quarter. Compared to the fourth quarter, the first quarter saw a decrease in personal consumption expenditures from 1.9% to 0.5%; investment rose from 2.3% to 7.9%; exports increased from -3.2% to 10.9%; imports increased from -1.0% to 11.8%; and government spending increased from -5.6% to 4.4%.
- According to the latest Personal Income and Outlays report, personal income increased 0.7% in May. Personal consumption expenditures, a measure of consumer spending, rose 0.7% last month. The personal consumption expenditures price index, a measure of inflation, increased 0.4% in May and advanced 4.1% over the last 12 months. Core prices, excluding food and energy, increased 0.3% in May and 3.4% from May 2025.
- Sales of new single-family homes declined 7.3% in May from April and were 6.8% below the May 2025 rate. Inventory rose to a 10.3-month supply, up from 9.3 months in April and above the 9.7-month estimate from a year earlier. The median sales price in May was $424,900. This was 2.0% above the April price of $416,500 and virtually unchanged from the May 2025 price of $424,800. The average sales price of new houses sold in May was $540,600. This was 7.8% above the April price of $501,400 and 5.0% higher than the May 2025 price of $514,800.
- New orders for manufactured durable goods decreased 4.5% in May after increasing 8.5% in April. Excluding transportation, new orders increased 1.3%. Excluding defense, new orders decreased 4.6%. Transportation equipment, also down following two consecutive monthly increases, drove the overall decrease, falling 14.0%.
- The advance report on international trade in goods showed the deficit was $105.8 billion in May, up $22.7 billion, or 27.4%, from April. Exports of goods for May were $207.7 billion, $11.8 billion, or 5.4%, less than April exports. Imports of goods for May were $313.4 billion, $10.9 billion, or 3.6%, more than April imports.
- For the week ended June 20, there were 215,000 new claims for unemployment insurance, a decrease of 12,000 from the previous week’s level, which was revised up by 1,000. According to the Department of Labor, the advance rate for insured unemployment claims for the week ended June 13 was 1.2%, unchanged from the prior week’s rate. The advance number of those receiving unemployment insurance benefits during the week ended June 13 was 1,821,000, an increase of 21,000 from the previous week’s level, which was revised down by 10,000. States and territories with the highest insured unemployment rates for the week ended June 6 were Puerto Rico (2.2%), New Jersey (2.0%), Massachusetts (1.9%), Washington (1.9%), California (1.8%), Minnesota (1.7%), Rhode Island (1.7%), Nevada (1.6%), Oregon (1.6%), Illinois (1.5%), and New York (1.5%). The largest increases in initial claims for unemployment insurance for the week ended June 13 were in Pennsylvania (+3,814), Minnesota (+1,587), Oregon (+1,536), Kentucky (+1,401), and Michigan (+791), while the largest decreases were in Illinois (-2,164), Ohio (-2,163), South Carolina (-1,856), Puerto Rico (-1,673), and New York (-1,536).
- The national average retail price for regular gasoline was $3.914 per gallon on June 22, $0.138 per gallon below the prior week’s price but $0.701 per gallon higher than a year ago. Also, as of June 22, the East Coast price decreased $0.136 to $3.777 per gallon; the Midwest price dipped $0.138 to $3.723 per gallon; the Gulf Coast price declined $0.084 to $3.437 per gallon; the Rocky Mountain price decreased $0.259 to $3.845 per gallon; and the West Coast price declined $0.172 to $5.057 per gallon.
Eye on the Week Ahead
The markets are closed this Friday in celebration of the Fourth of July holiday. However, the labor report for June is available on Thursday. May saw employment increase by 172,000.
The Week Ahead

The information provided is obtained from sources believed to be reliable. Forecasts cannot be guaranteed. Past performance is not a guarantee of future results.
Data sources: Economic: Based on data from U.S. Bureau of Labor Statistics (unemployment, inflation); U.S. Department of Commerce (GDP, corporate profits, retail sales, housing); S&P/Case-Shiller 20-City Composite Index (home prices); Institute for Supply Management (manufacturing/services). Performance: Based on data reported in WSJ Market Data Center (indexes); U.S. Treasury (Treasury yields); U.S. Energy Information Administration/Bloomberg.com Market Data (oil spot price, WTI, Cushing, OK); www.goldprice.org (spot gold/silver); Oanda/FX Street (currency exchange rates).
© 2026 Broadridge Financial Solutions, Inc. All Rights Reserved.