Wall Street analysts and media are rightfully criticized for putting too much emphasis on quarterly earnings. What investors want is for managements to build the value of their businesses over time. One quarter’s results are seldom make-or-break events. Earnings, however, are what ultimately determine stock prices so without putting too much emphasis on a single quarter, it is worth a few moments to check the data for trends.
Thanks to FactSet’s Earnings Insight, we see as of Friday, 55% of the companies in the S&P 500 had reported results for Q4 2016 and 65% of those companies beat the mean EPS estimate and 52% of companies beat the mean sales estimate. For Q4, companies are reporting earnings growth of 4.6% and revenue growth of 4.6%. For all of 2016, companies are reporting earnings growth of 0.2% and revenue growth of 2.3%. Analysts are projecting earnings growth of 11.1% and revenue growth of 5.8% for all of 2017.
What we can say about the data is the trend in corporate earnings does not diverge from the big picture economic model which has developed over time. The shallow growth trend continued through 2016 just as it has in prior years. Expectations for a more robust economy are present as they have been throughout this recovery. The forward looking statements above should be used with great caution as they are subject to risks and uncertainties, which could cause actual results to differ substantially from those anticipated.
What We Are Watching So You Don’t Have To
On The One Hand
- Personal income increased 0.3% in December, strengthened by a 0.4% rise in wages and salaries. Real disposable personal income increased 0.1%.
- The PCE Price Index was up 1.6% year-over-year up from a 1.4% increase in November. The Fed’s target of 2.0% will signal further rate hikes. The core PCE Price Index was up 1.7% year-over-year, unchanged from November.
- Personal spending increased 0.5%. Real personal consumption expenditures increased 0.3%, with goods spending up 0.5% and services spending up 0.3%. The savings rate as a percentage of disposable income fell to 5.4% from 5.6%.
- Seasonally adjusted compensation costs for civilian workers increased 0.5% in the fourth quarter. Wages and salaries, roughly 70% of compensation costs, rose 0.5% in Q4 and benefits increased 0.4%. Year over year compensation costs for civilian workers increased 2.2%.
- The seasonally adjusted January Manufacturing ISM Index rose to 56.0% in January from a downwardly revised 54.5% in December. Expansion is indicated.
- Initial jobless claims dropped 14,000 to 246,000 in the week ending 1/28. Continuing claims for the week ending January 21 dropped 39,000 to 2.064 million
- January nonfarm payrolls surprised with an increase of 227,000. Private sector payrolls increased by 237,000. The unemployment rate was 4.8%, up from 4.7% in December, the result of an increase in the labor participation rate from 62.7% to 62.9%. The U6 unemployment was reported at 9.4%. Hourly earnings increased a disappointing 0.1%. Over the last 12 months, average hourly earnings rose 2.5%. The average workweek was 34.4 hours, unchanged from December.
- Factory orders were up 1.3% in the month of December, much improved from the 2.3% decline in November. Manufacturing shipments increased 2.2% after the 0.3% increase in November.
- The January, ISM services index registered at 56.5%, down slightly from 56.6% in December but the greater than 50% reading continued to signal growth.
On The Other Hand
- The January, Chicago PMI fell to 50.3 from a negatively revised reading of 53.9 in December. The neutral reading for this index (neither expansion nor contraction) is 50.
- The Consumer Confidence Index dipped to 111.8 in January from a negatively revised 113.3 in December. The December reading was a 15-year high so consumer confidence is likely taking a breather.
- Construction spending dipped 0.2% in December following a 0.9% increase in November. Non-residential spending declined 0.7% while residential spending increased 0.4%.
- Light vehicle sales were reported at a seasonally adjusted annual rate (SAAR) of 17.61 in January, down from 18.43 million units for December and 17.89 million units for January 2016. Total domestic sales declined to 13.89 million from 14.55 million in December. Domestic truck sales declined slightly to 9.22 million SAAR in January from 9.25 million in December.
- Preliminary Q4 productivity increased at an annual rate of 1.3%. Output increased 2.2% and hours worked rose 0.9%. The report was a disappointment following the revised 3.5% growth rate reported in Q3. For all of 2016, nonfarm business sector productivity increased just 0.2%. Unit labor costs rose 1.7% in Q4 following an increase of 0.2% in Q3. Hourly compensation rose 3.0% and productivity increased 1.3%.
All Else Being Equal
Rising compensation costs are a welcome development for employees. At the same time, in the near term at least, higher compensation costs will constrain employer profit margins. A continuation of this trend has the potential to begin a cost-push inflationary cycle over time. If costs continue to rise, employers will attempt to regain margins by raising prices. If price increases stick and if labor markets are sufficiently tight, employees will respond by demanding higher compensation in order to afford the higher prices of goods and services. Notice the multiple “ifs” in the previous statements and know an inflationary spiral is not a given at this time but it is a more likely possibility.
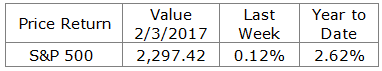
Last Week’s Market
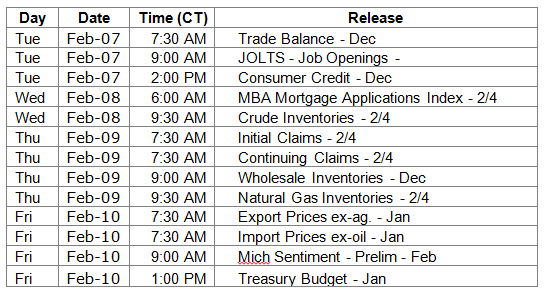
The Week Ahead
The information provided is obtained from sources believed to be reliable. Forecasts cannot be guaranteed. Past performance is not a guarantee of future results.